CSCI39542project
Crime in Parks and its Relevancy in NYC
Abstract
I wanted to see statistics of crimes occuring in parks throughout the five boroughs of NYC and compare them to total crime in NYC to see if it was a significant problem or not. I wanted to delve into this information because I personally live near a park that’s not at all dangerous during the daytime, but becomes a sketchy place to walk in during the night. I gathered data from official documentation provided by the NYPD of all five boroughs and sorted them using pandas. Results show that across all five boroughs, crime occuring in parks was not a statistically significant portion of overall crime, harboring only 0.8% of all crime in the boroughs.
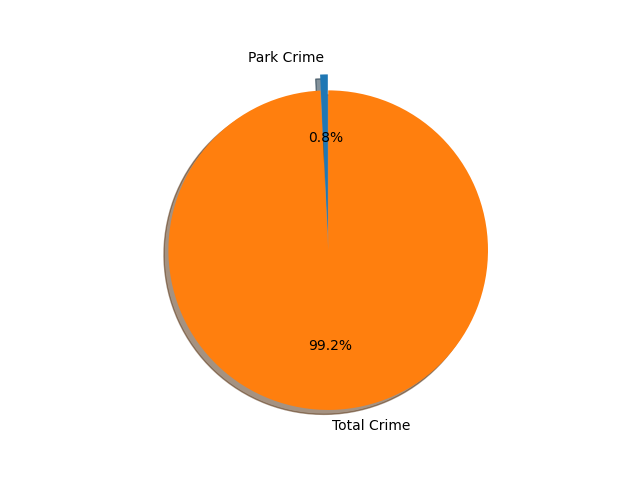
Crime in Parks vs Total Crime
The total amount of crime contributed to NYC that occured during parks was less than 1% for 2021. This does not include the fourth quarter of the year yet, but could go over a 1% contribution. This piece of information definitively displayed to me that crime in parks although is problematic, it also is not a very large issue at hand.
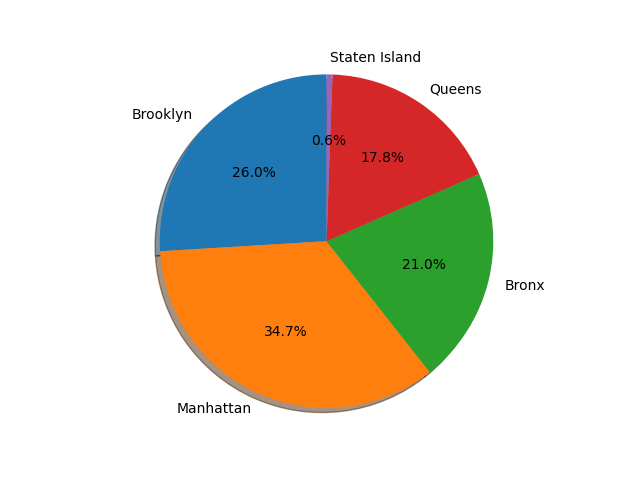
Crime in Parks Across all Five Boroughs
This chart compares the number of crimes that occured during parks in each borough. Manhattan takes the lead in the majority of park crime followed by Brooklyn and the Bronx. Interestingly enough is that Staten Island is at less than 1%, which is a huge disparity between the rest of the boroughs at over 17%.
Techniques
I first needed to convert the data given by the NYPD from xlsx to csv. After reading their dataframes, I scraped the information I needed by using pandas to sum columns with specific row names. This was how I could retrieve the total number of crimes in parks given the parks dataframe. I then referred to the total crime in NYC boroughs for 2021 and displayed the comparisons between the numbers via matplotlib’s pie charts.